Mapping the Atlantic seafloor one mission at a time
Landing an opportunity to chart the under-explored seafloor of the Atlantic Ocean is an eye-opening experience for ocean mapping students at the Marine Institute’s School of Ocean Technology.
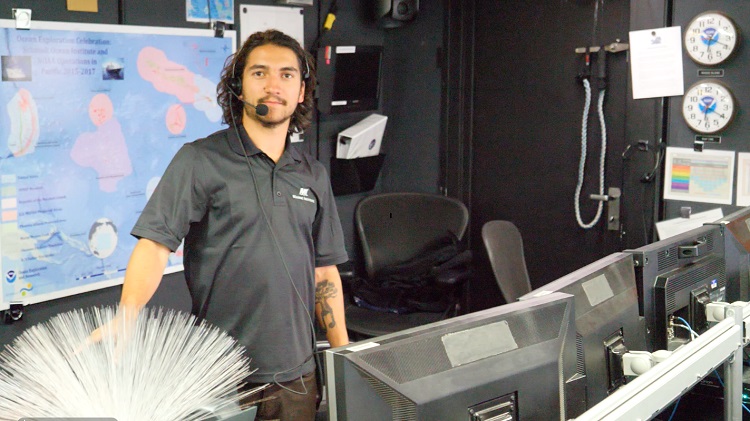
For Daniel Amirault, 20 days mapping the seabed in deep waters southeast of Bermuda last summer drove home classroom lessons in hydrographic surveying and affirmed his career plans to explore the world’s oceans.
Now in the third-year of a joint, four-year diploma and bachelor of technology in ocean mapping, he was the only Canadian student to participate in the multi-national mission on board the U.S. research vessel Okeanos Explorer.
“It’s a whole different world out there when you walk out on deck and see the ocean surrounding you,” said Mr. Amirault. “I really liked the whole aspect of constantly exploring and the importance of the work we’re doing was really cool to see.”
Unique opportunity
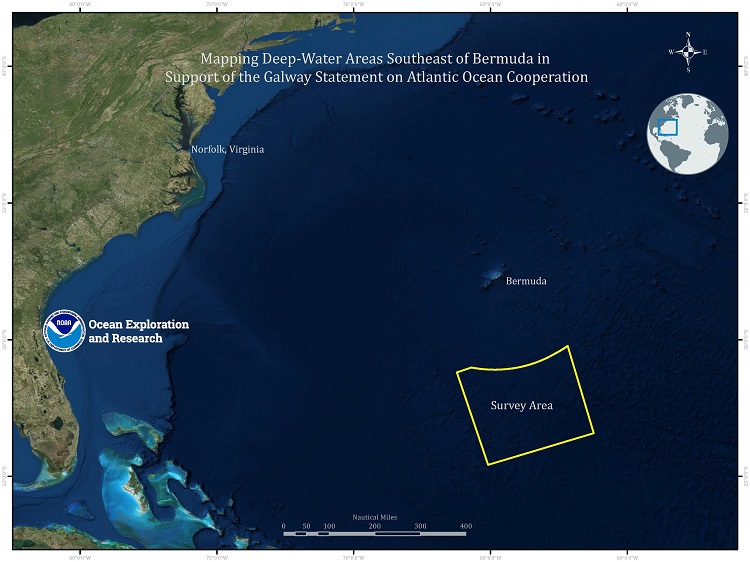
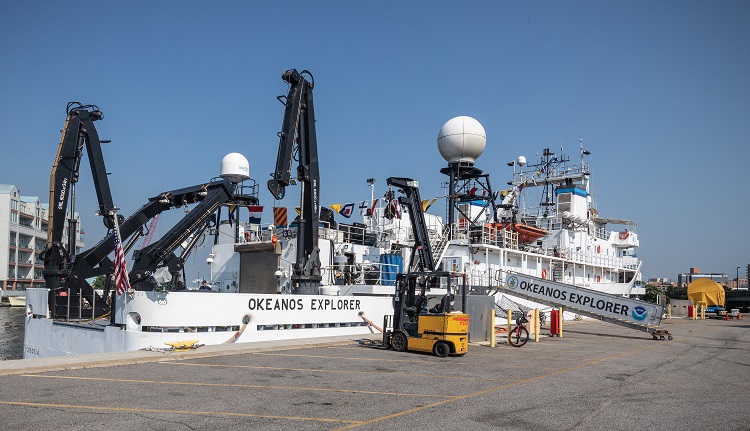
Operated by the U.S. National Oceanic and Atmospheric Administration, the Okeanos Explorer surveyed the seabed in water depths ranging between 4,500 metres and 5,500 metres.
The Bermuda mission was the first U.S.-led expedition in support of the 2013 Galway Statement on Atlantic Ocean Cooperation, which commits Canada, the European Union and the United States to work together to map the entire Atlantic seafloor. These maps are important in the study of deepwater habitats, sea life and environmental changes, as well as in site selection for offshore platforms, cables, wind turbines and mineral extraction.
“We don’t know what’s there because it hasn’t been mapped,” said Paul Brett, head of the School of Ocean Technology. “It was a unique opportunity for an undergraduate student to get on this mission. He ran watches and collected hydrographic multibeam data which is a big part of his ocean-mapping program.”
New seafloor data
The team of scientists and students onboard the Okeanos Explorer mapped more than 52,000 square kilometres of uncharted seabed – including an area larger than the state of Massachusetts containing a previously unknown seamount, conical features rising more than 900 metres above the seafloor and linear ridges running 11 kilometres in length that may be volcanic in origin.
“There’s barely any data in that entire area and it’s a big help to a lot of scientists that we acquired it,” said Mr. Amirault. “It opens doors to so many more discoveries.”
Utilizing the new data, scientists also take a closer look at the ocean floor with remotely operated vehicles (ROVs) on board the vessel to record images of marine life and seabed features.
“We’re looking for different, interesting features so that other scientists can use ROVs to dive down and get greater detail.”
Equipped with 24-hour telepresence technology, the vessel sends real-time ROV images to shore via satellite – allowing scientists to follow, guide and study any discoveries made during the survey.
Watchstanding
As a watchstander on the vessel’s day shift, Mr. Amirault kept a close eye on all the data collected and displayed on computer monitors as the sonar mapped the seafloor one swath at a time. Other monitors displayed information, such as vessel speed, air temperature, direction of the ocean current and the ship’s position.
“There’s a lot of things going on at once. We would write the details in a log, and we did a whole checklist to make sure everything was working properly.”’
The Okeanos Explorer also uses a Kongsberg EM302 multibeam sonar capable of collecting seafloor data in water depths up to 7,000 metres. As the vessel sails back and forth in straight lines, the sonar sends multiple sound pulses, or “pings,” toward the seafloor. The longer it takes those pings to return, the deeper the water – and by measuring each ping’s return time scientists can create bathymetric charts of the seafloor.
Bathymetry is the measurement of water depth in oceans, rivers or lakes. Similar to topographic maps used on land, bathymetric charts show the elevation and shape of seafloor features.
Software and sensors
Using specialized software, Mr. Amirault also examined and cleaned the survey data before it’s sent to onshore facilities and made publicly available to scientists. This software enables watchstanders to see all the seafloor points mapped by the vessel’s multibeam sonar to determine which points to reject or accept.
“There’s always a very dense zone where there’s a lot of points that follow the same area, so you know it’s tracking along the seafloor. Then, you’ll have a few outliers that are separated from the rest and you delete these stray points.”
Every six hours, he also deployed sensors known as expendable bathythermographs (XBTs) into the ocean. XBTs measure temperature and depth – data that assists in creating sound-velocity profiles of the water column. If the water temperature readings change frequently, more sensors are deployed.
This information also assists in adjusting the multibeam sonar mapping system to ensure data accuracy.
“When it changes, sound speed affects how your system gets readings from the seafloor.”
Atlantic Ocean cooperation
Along with mapping the entire Atlantic seabed, the goals of trilateral Galway agreement include collecting and sharing ocean observation data, protecting the ocean as a shared resource, promoting sustainable management of its resources and enhancing ocean literacy.
The Atlantic Ocean Research Alliance (AORA) and Atlantic Seabed Mapping International Working Group (ASMIWG) work together to help achieve the Galway goals. The Marine Institute is a member of ASMIWG.
AORA was created to build a transatlantic research community using the latest technology to conduct mapping missions of the seafloor – acquiring critical baseline data and advancing knowledge of oceanographic currents, key species, ecosystems and potential resources.
ASMIWG’s job is to develop and implement a mapping strategy to meet the Galway objectives.